




Metric moves. Owner notified. Action tracked. Impact verified.
The whole platform rests on one causal model of your business, built from your warehouse, your semantic layer, your business apps and your org chart. Every claim on it is earned: correlations are re-tested nightly, hypotheses survive a cascade of statistical tests, and action plans prove their impact in the real world. Canopy records the context that explains the numbers, and agentic workflows act on that evidence, so agents move the business, not just describe it.

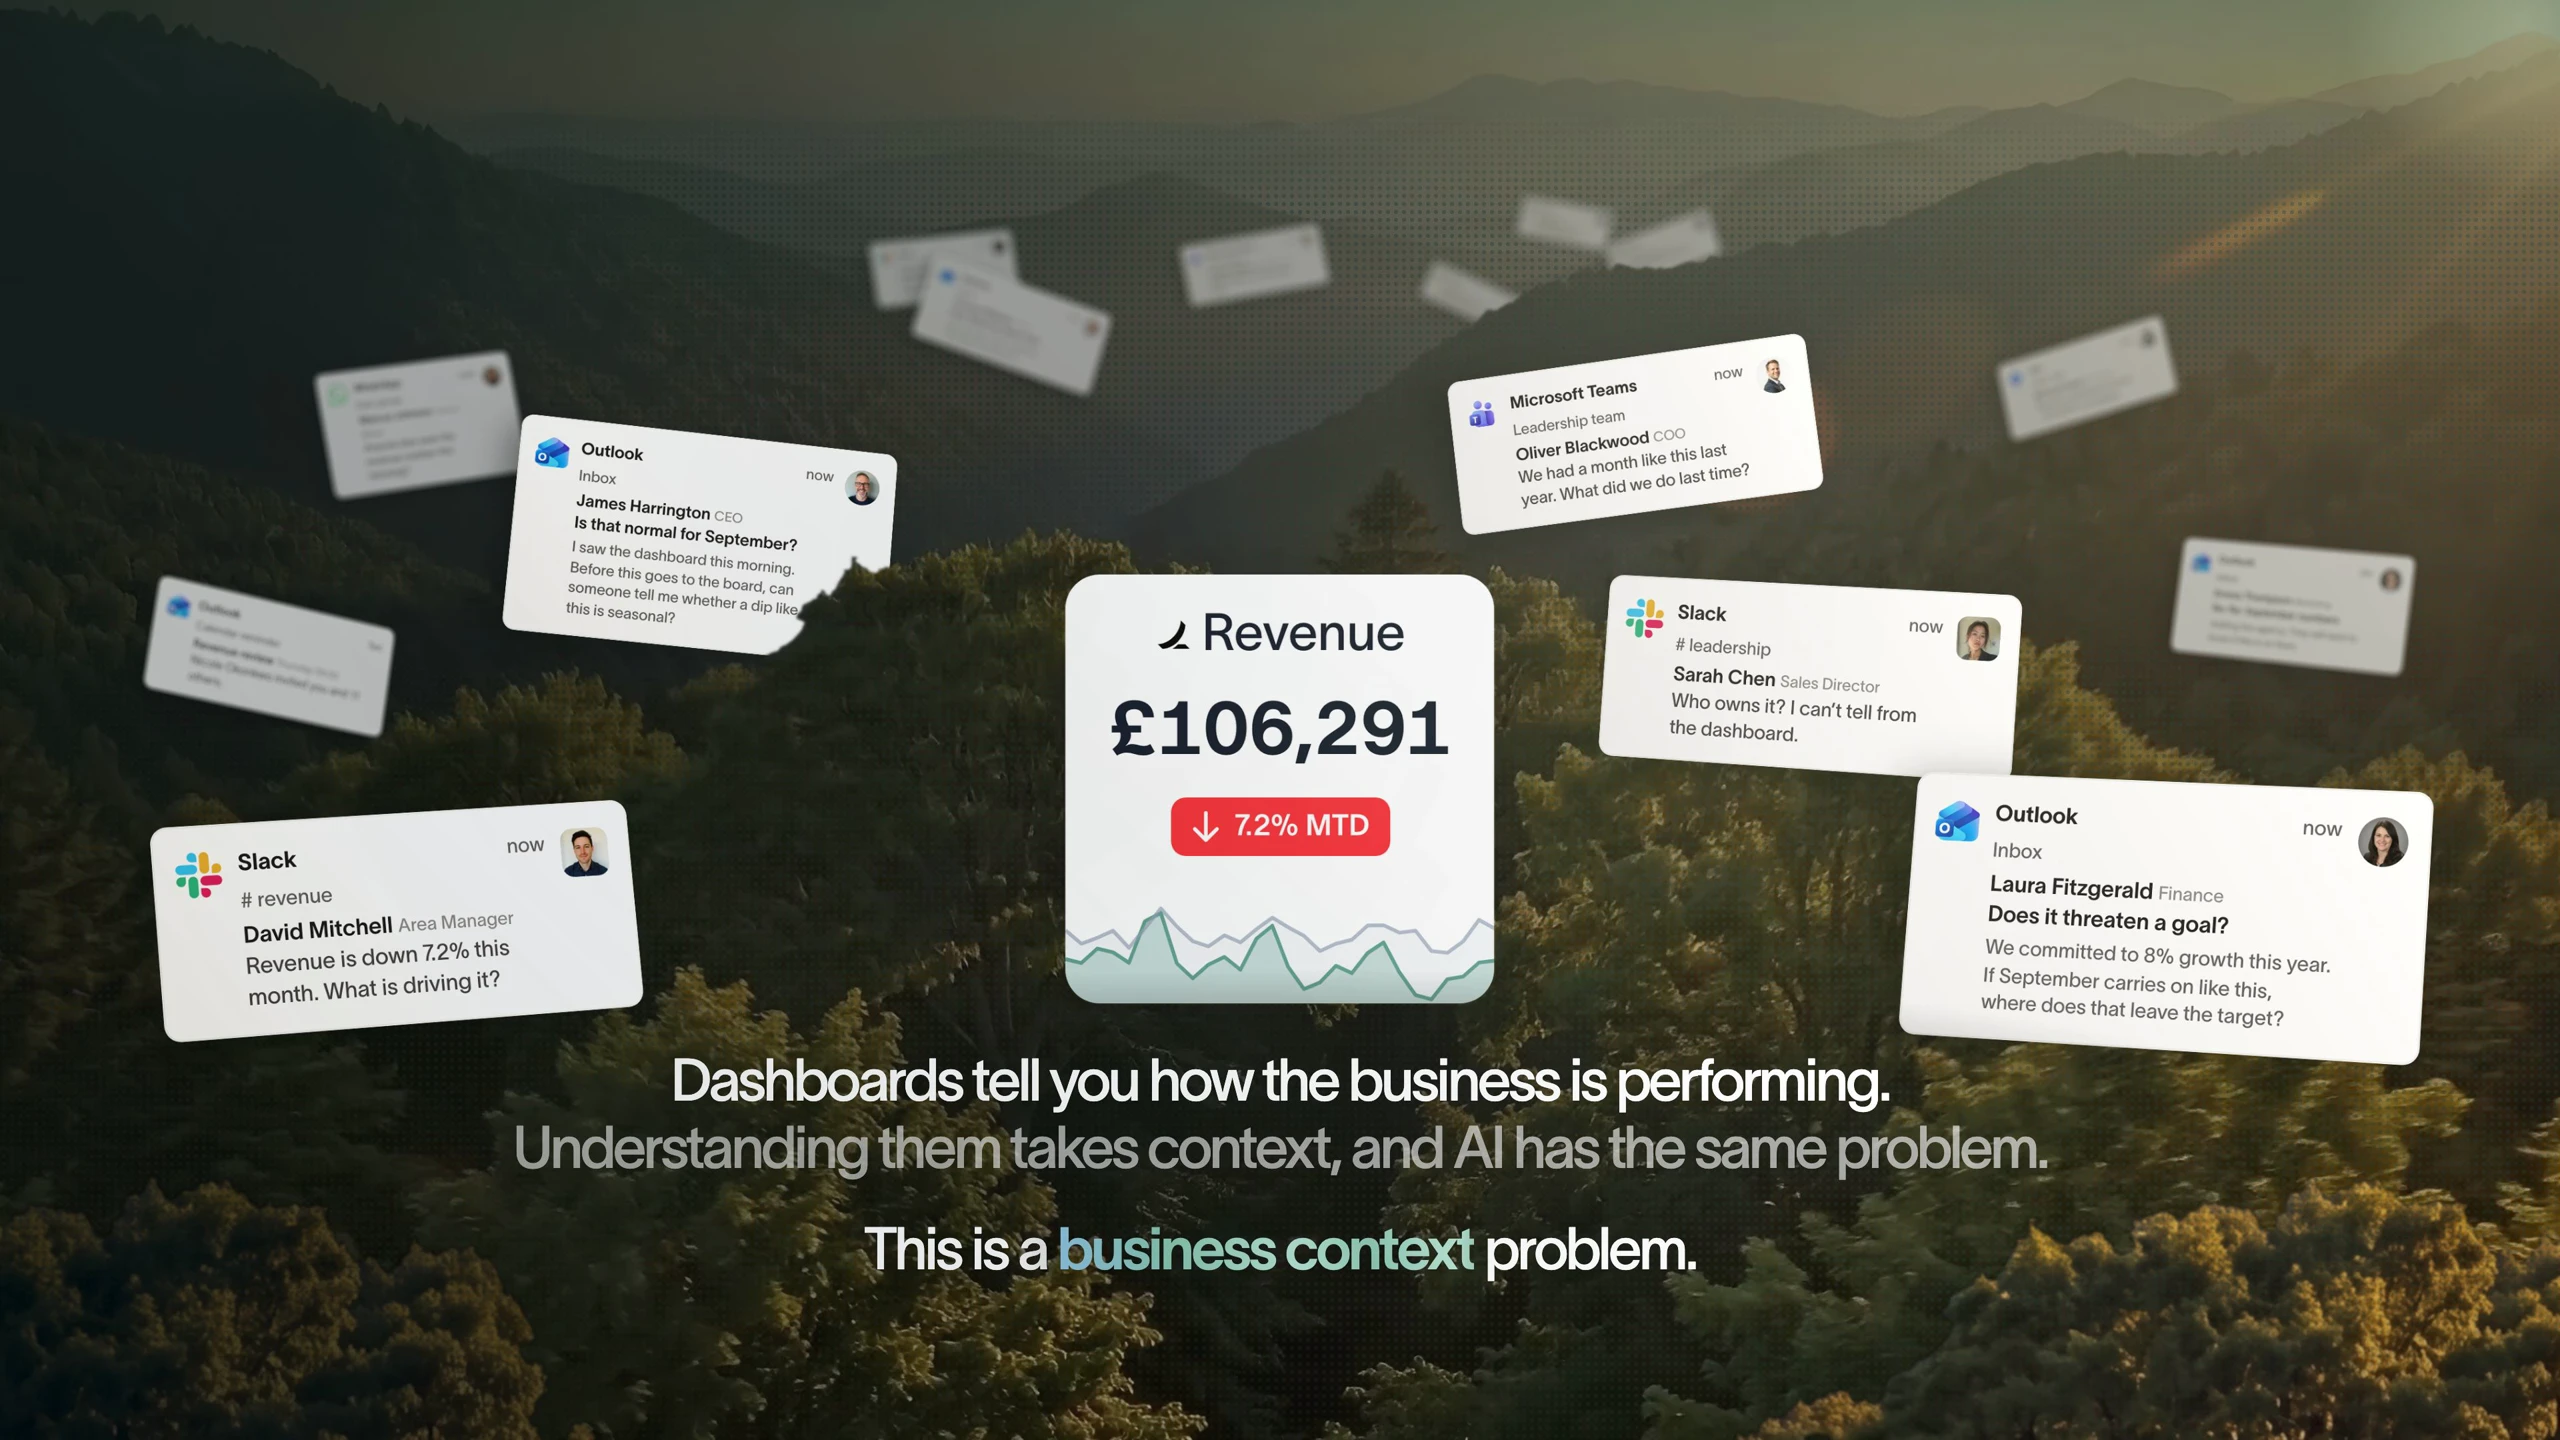
This is not a replacement for your BI tool. It does two things a dashboard never could. It grounds your agents in business context they can't get anywhere else, so every answer reflects how the business actually works. And it shows your people the whole system and their place in it, so they understand the business far better and act with confidence.
Data warehouses
The numbers


Semantic layers
The definitions


Business apps
Launches, decisions, blockers


Org structure
Directory-synced


For humans
Answers, briefings and pushes
 @
@Read and write over MCP
Anthropic: 21% → ~95% with curated context




Canopy Agentic Workflows the metrics start them, humans gate them
Canopy Agents four out of the box, any model, your keys
Canopy
The business context layer
Structural context The causal tree, the org chart
Temporal context What was true when, plan against actual
Behavioural context What people did, what worked
Operational context RACI, workflows, approvals
Strategic context Objectives, key results, initiatives
Map & Measure
Metric Trees
Business Models
Prove & Act
Root Cause
Ownership
Verified Impact
Strategy
Grounded in proven causality
Verified proof
Meta spend → Revenue, +£32k vs forecast, q < 0.01
Personalised Action Plans 31 experiments running
hypothesis → a real person’s plan → measure the change
Causation the test cascade
ADF p 0.02 → Granger p 0.003 → q < 0.05, 87 of 1,204 survive
Correlation
22,791 pairs tested nightly, NPS – Churn r 0.71
Data warehouses
The numbers
Semantic layers
The definitions
Business apps
Launches, decisions, blockers
Org structure
Directory-synced
Grounded in proven causality. Every driver tested, every owner named, every action verified.

Grounded in proven causality. Every driver tested, every owner named, every action verified.
Data warehouses
The numbers
Semantic layers
The definitions
Business apps
Launches, decisions, blockers
Org structure
Directory-synced
Verified impact
Personalised action plans
Statistical causation
Correlation
One causal model, not a folder of dashboards
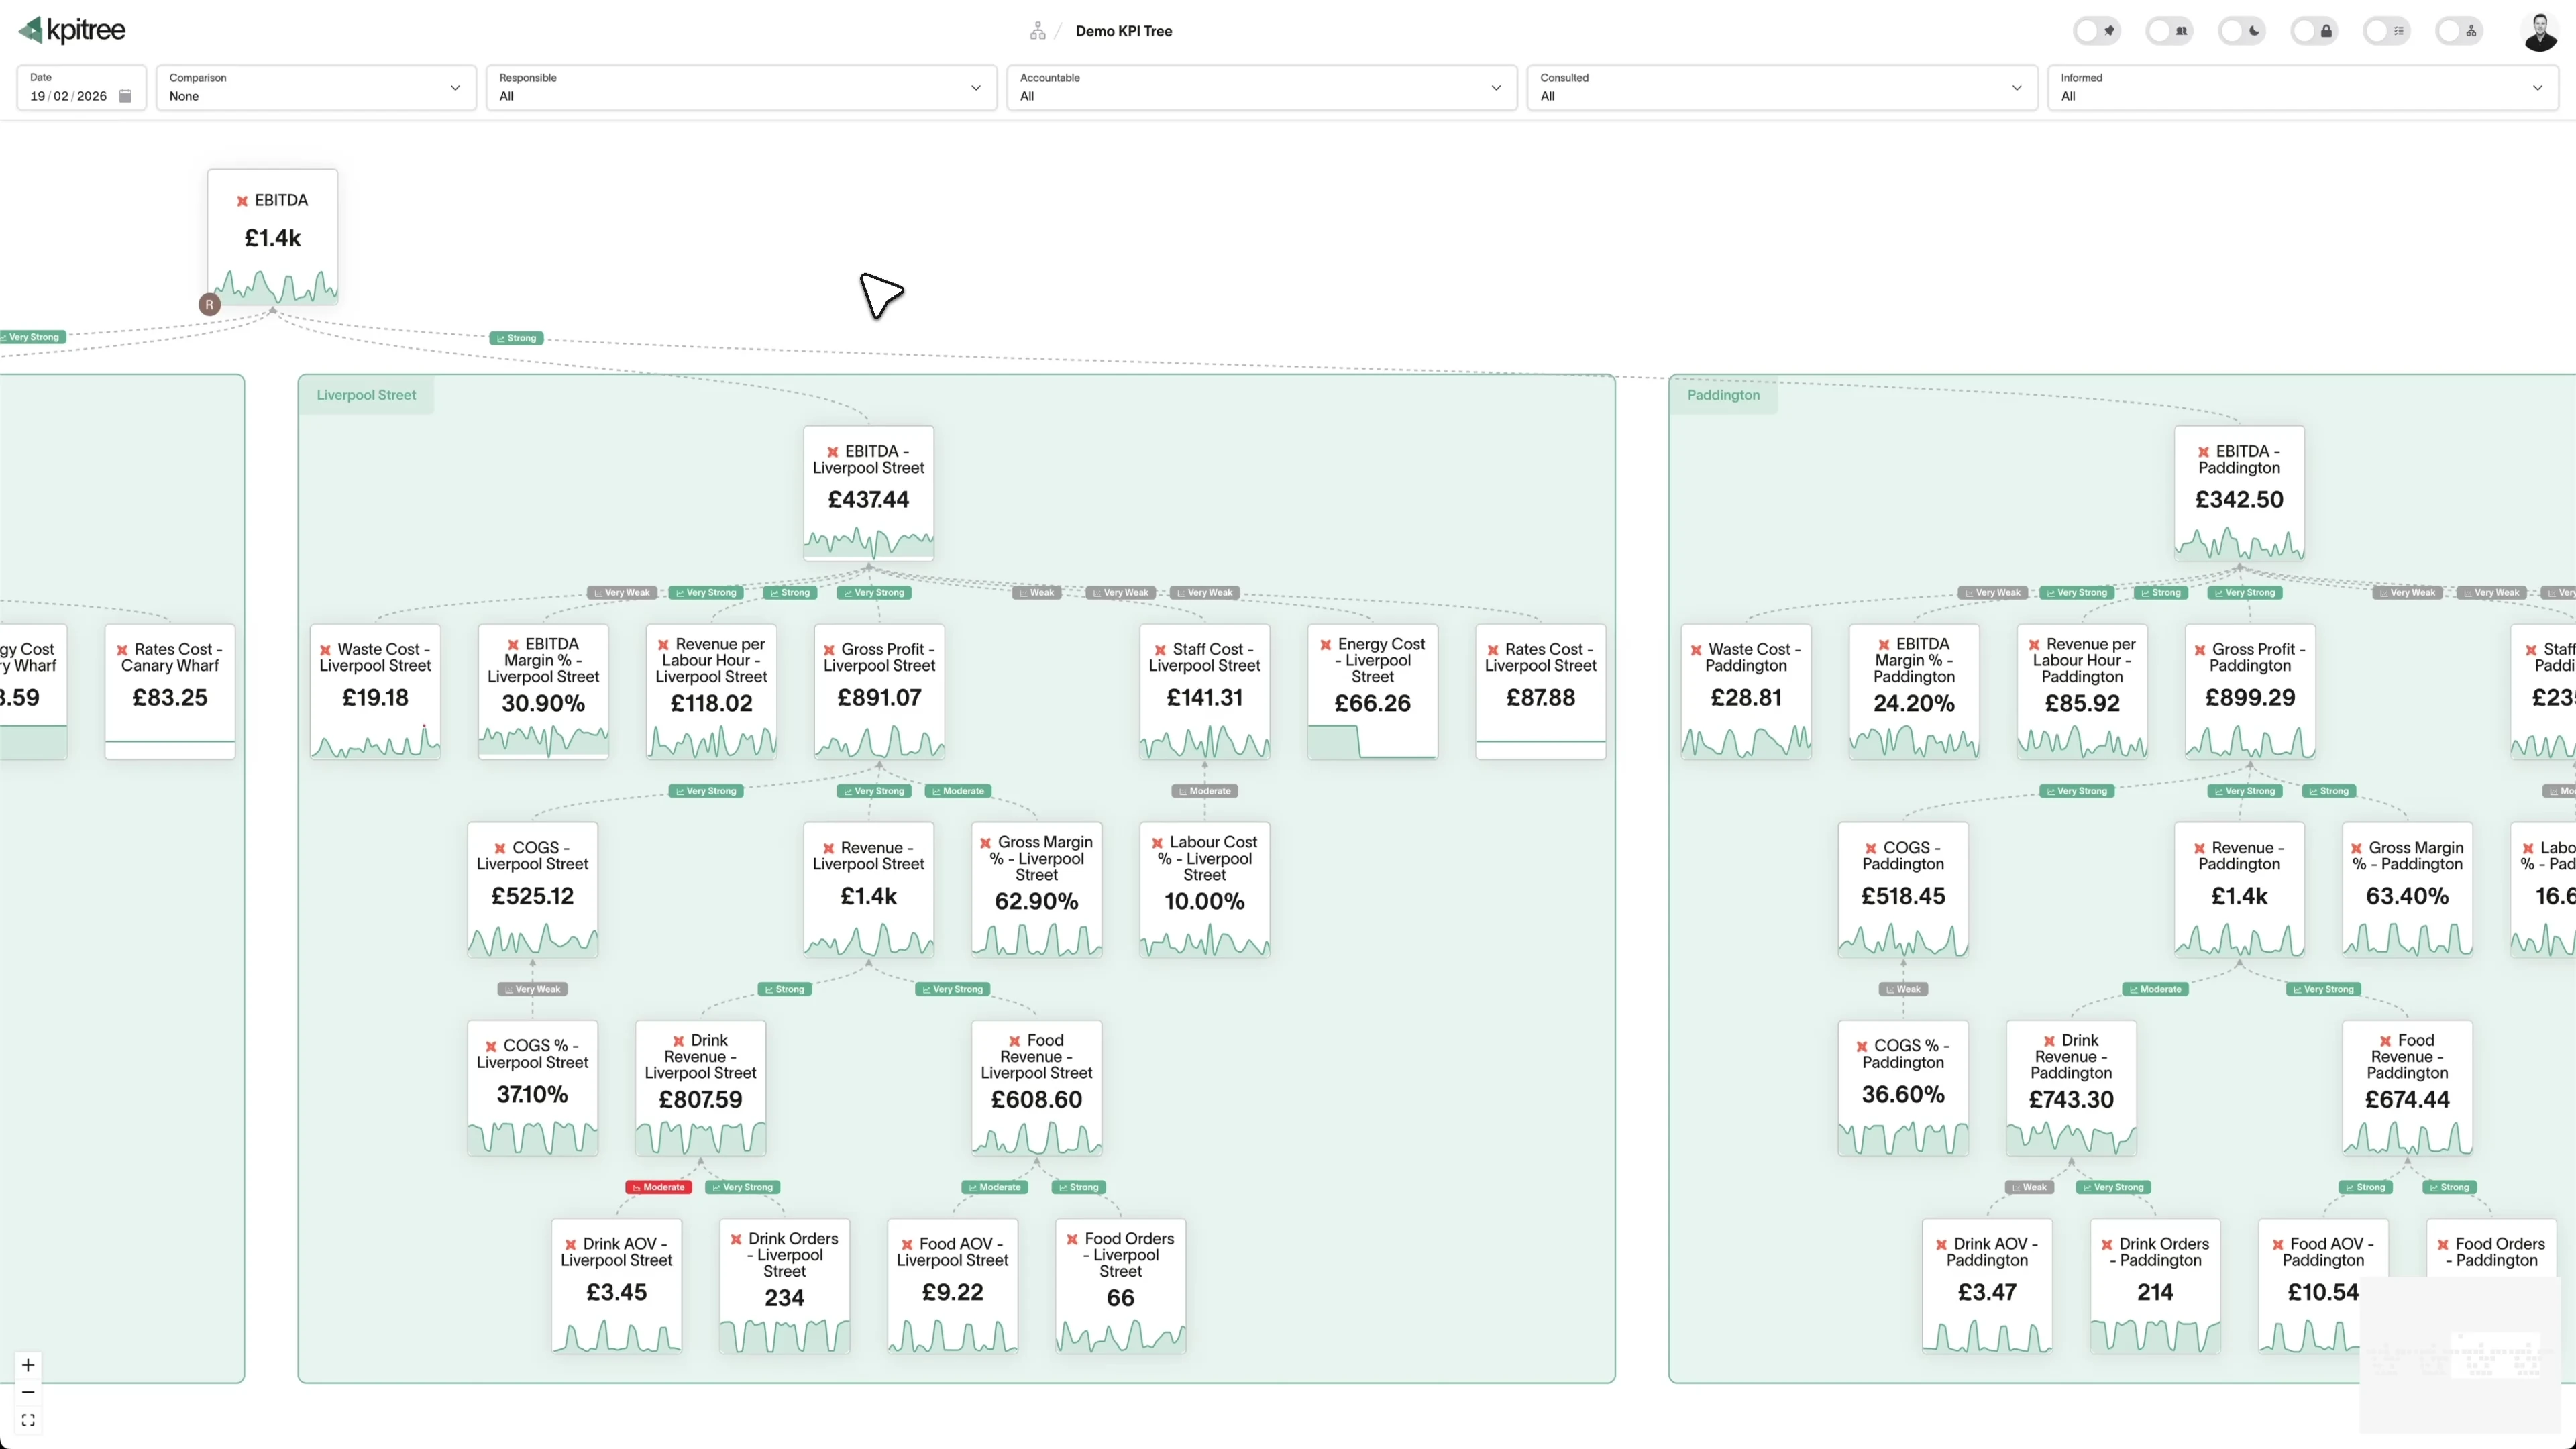
Every relationship is a directed driver edge with confidence attached. AI drafts it, your team corrects it, your data decides. It is the ground truth your AI agents inherit.
Every relationship found for you, not drawn by hand
The nightly sweep re-tests every pair of metrics you have, whether or not anyone has drawn a relationship between them, and surfaces the ones that move together, ranked by strength. That is where a hypothesis starts, and never where it ends: a candidate waiting to be tested, not a finding.
Candidates, not findings. Re-tested every night.
Causality proven statistically, not asserted in a narrative
Correlation alone is not causation, so every edge is run nightly through proprietary ML models and statistical tests, from Pearson correlation to Granger causality, Benjamini-Hochberg corrected. Then the people who know the business prune what the statistics cannot see.
Every driver edge. Every night.
A personalised action plan, for every employee
Each surviving hypothesis becomes a plan for the person who owns the lever, with the driver attached and a window to measure it in. The Accountable owner is notified the moment the metric moves, so everyone sees the few things that fall to them.
Sarah Chen
Accountable · ConversionDavid Mitchell
Responsible · Paid traffic
Emma Thompson
Accountable · Cash collectedImpact verified, then the model learns
When the window closes, the outcome is measured against the counterfactual forecast. What held becomes a verified driver edge, the objective it serves updates on the strategy map, and the next plan starts from what actually worked.
Fix checkout flow
Verified · +£32kLinked to Revenue · measured by the actuals pipeline
Pause underperforming ad sets
Measuring…See cause and effect across your entire business
Decompose your North Star into every lever your teams control. Every relationship has a direction and a measurable strength. The Five Whys, pre-answered.
See the causal model. Ask it anything. That's explainable AI.
Write me a summary of business performance for the CEO covering all metrics in the Growth Tree Show me MRR with quarter over quarter and year over year comparisonsWhy is
  Net Revenue Retention up 8% over the trailing 30 days?Analyse Revenue and explain why it's down 12% month over monthPrepare a weekly performance briefing for the leadership team with all metrics that are off trackWrite me a summary of business performance for the CEO covering all metrics in the Growth TreeShow me MRR with quarter over quarter and year over year comparisonsWhy is Net Revenue Retention up 8% over the trailing 30 days?Analyse Revenue and explain why it's down 12% month over monthPrepare a weekly performance briefing for the leadership team with all metrics that are off trackWhat's driving the 18% drop in Revenue month over month and rank by impact score?Show me the top drivers of Churn Rate with correlation scores above 0.7Which metrics have the highest impact score on Customer Lifetime Value this quarter?Find what's driving Conversion Rate up and show me the impact score breakdownRank all drivers of MRR by quarter over quarter impact scoreWhat's driving the 18% drop in Revenue month over month and rank by impact score?Show me the top drivers of Churn Rate with correlation scores above 0.7Which metrics have the highest impact score on Customer Lifetime Value this quarter?Find what's driving Conversion Rate up and show me the impact score breakdownRank all drivers of MRR by quarter over quarter impact scoreCompare Revenue by store and show month over month changes for eachUpdate the weekly ops deck with the latest numbers from the Operations TreeBreak down Signups by channel and highlight which dropped the most month over monthExplore the order entity and show me all linked metrics with their trendsCompare Average Order Value by region with year over year changesCompare Revenue by store and show month over month changes for eachUpdate the weekly ops deck with the latest numbers from the Operations TreeBreak down Signups by channel and highlight which dropped the most month over monthExplore the order entity and show me all linked metrics with their trendsCompare Average Order Value by region with year over year changesSet Sarah C. a task to increase MRR to £2.5M by end of Q1Search for all metrics related to retention and show their RACI ownersShow me all metrics owned by David M. that are below target with month over month changesAssign
  Sofia M. a key result to reduce Churn Rate by 15% this quarterWhich objectives are at risk this quarter and which initiatives are targeting them?Which metrics does James H. own that have a negative trend this quarter?Set Sarah C. a task to increase MRR to £2.5M by end of Q1Search for all metrics related to retention and show their RACI ownersShow me all metrics owned by David M. that are below target with month over month changesAssign Sofia M. a key result to reduce Churn Rate by 15% this quarterWhich objectives are at risk this quarter and which initiatives are targeting them?Which metrics does James H. own that have a negative trend this quarter?
Canopy grounds Claude in business context it can't get anywhere else. Yes, even from your semantic layer.
Your semantic layer tells AI how a metric is calculated. Canopy adds what a definition cannot: how the business fits together, what was true when, who owns each number, what people did about it and whether it worked, and where the plan is heading. Every claim is checked against the numbers and carries its provenance.
Canopy is your company brain. Five kinds of context on one governed layer, every claim checked against the causal model before it counts. It remembers what moved, who acted and whether it worked.
Derived from your data
Proven causal relationships between your governed metrics, and how they change over time.
Structural and temporal context starts from the metric definitions your semantic layer already governs. On top of them, every driver relationship carries a tested strength, re-measured nightly, and every metric is kept at every date, so the model reads the business as it was and as it is.
Structural context · How the business fits together
The metric tree and the org chart: which metrics drive which, with statistical confidence on every edge, and who sits where, kept current from your warehouse, your semantic layer and your directory.
 Revenue
£384k
4.2%AOV
£7.25
5.8%Orders
52,998
2.1%
Temporal context · What was true when
Every metric at every date in your history, with more than twenty comparison frames already computed, and the plan alongside: budgets, reforecasts and targets run through the same pipeline as actuals, so an agent can read the quarter as it looked on the day a decision was made.
Date
21 / 09 / 2026
Comparison
Month on Month (MoM)
Revenue
Month to date, as at 21 Sep 2026
£384,296
- vs Aug MTD
- 4.2%
- vs Sep 2025 MTD
- 1.8%
- vs budget
- 3.1%
Orders
52,998
AOV
£7.25
Recorded as the business runs
What happened after the insight. What people did, decided and planned.
Operational, behavioural and strategic context, captured as work happens in KPI Tree and your business apps.
Behavioural context · What people did, and whether it worked
Every action sits on the company timeline against the metric it means to move: who took it, when, and the window it is measured in. When the window closes the result is kept, so the next decision starts from what actually worked, not from memory.
Company Snapshot
- Task
- Proposed
- Accepted from Canopy
- Decision
- Blocker
Sun
6
Mon
7
Today
8
Wed
9
Sarah Chen
Head of Operations
David Mitchell
Area Manager
Emma Thompson
Growth Lead
Operational context · RACI, workflows, approvals
An always-current RACI on every metric and objective, who reports to whom, and who is away this week. It is what lets an answer become an action routed to a named person.
Revenue
Who owns this metric, who acts on it, and who is kept in the loop.
SuggestResponsible
David Mitchell
Area Manager, Operations
Emma Thompson
Growth Lead, Marketing
Laura Fitzgerald
Head of Sales, Revenue
Accountable
Consulted
Informed
Nobody
Strategic context · Objectives, key results, initiatives
Every objective, its key results and the funded initiatives behind them, held alongside the metrics they target. So when an agent recommends a tactical action on a metric, it knows which strategic bet that action serves, and the day-to-day work stays aligned to the plan.
Reduce labour cost to below 28%
Sarah ChenThe proof
Numbers that prove the objective.
Key results
Labour cost ≤ 28%
29.4% → 28% target
Overtime hours below 4%
awaiting first read
The work
What the team does.
Initiatives
Rota optimisation
On trackCross-training
PlannedLearnt, curated, kept honest
Every fact keeps its trail. The provenance behind your institutional knowledge.
Everything starts from the proven causal model. Recorded context is layered on top, and nothing counts as a fact until it has been checked against the numbers. What the data contradicts is held back as a claim, what later results disagree with is retracted, and every item keeps where it came from.
Learnt and curated · Fact kept apart from opinion
Other platforms treat every message as context. Canopy tests each one against the numbers first. A sales lead saying twenty contracts closed is recorded as a claim. The warehouse says eighteen, so the item is held back and says so. Every night the claims that made it in are re-read against the results that came in, and what no longer holds is retracted.
What Canopy learnt
Keg prices, not footfall, explain the September food cost rise. Three of the four sites moved together in the week the supplier repriced. The sales channel's twenty August contracts are eighteen in the warehouse, so that stays a claim.
14
Confirmed by your own completed work
3
Dropped when later results disagreed
9
Noticed, but not claimed yet
Learning, nightly
Drag the timeline to look at any period.
38
Last 10 days
Keg prices up 8% from 1 Sep, all sites
Event · #ops · holds against Food cost %
Closed 20 contracts in August
Note · #sales · warehouse shows 18 closed-won
Canary Wharf stays out of the labour cost target
Decision · typed in by James Hart
From your people and your channels · Typed in, or read from Slack
Switch on a channel and Canopy reads it, keeping the message each item came from. Anyone can type a fact in plain language against a metric, with an expiry, and it is kept with their name on it. Both go through the same check before they count, and confidential items stay with the owners.
New context item
Context
Liverpool Street closes for a refit from 12 to 14 August. Expect no revenue those days, with the team covering Shoreditch.
State the fact in plain language. The kind, dates and attachments are worked out automatically.
Metric (optional)
Revenue · Liverpool StreetValid until (optional)
14 / 08 / 2026
Slack
4 channels
We benchmarked Canopy usingOpus 5, one warehouse, three ways in: Snowflake over MCPSnowflake Cortex AnalystCanopy withSnowflake Semantic Views
Pointed straight at the warehouse, or at Cortex Analyst's semantic model, Claude returns a number and works out the why from scratch on every question. On Canopy it reads a causal model that is already statistically tested, owned by name, and checked against what happened next. So you get the insight first time, not a number and then a week of follow-ups.
What happened in the business in August that explains the numbers?CanopyHad some of the contextAugust was a good month. The alarming numbers on the dashboard right now are September-to-date, not August — the health report's "EBITDA -21.8% MoM" is 1–9 Sep vs 1–9 Aug. Read on the full month, August looks like this:
| Aug 2026 | Jul 2026 | Aug 2025 | |
|---|---|---|---|
| Revenue | £378,621.99 | £364,535.26(+3.9%) | £368,140.79(+2.8%) |
| EBITDA | £111,351.63 | £99,888.10(+11.5%) | £114,655.61(-2.9%) |
| Gross margin % | 60.2 | 59.7 | 68.5 |
| COGS % | 39.8 | 40.3 | 31.5 |
| Labour cost % | 22.1 | 23.5 | 14.5 |
The finding: August sold more than last August and earned less. Revenue was up £10,481.20 year on year, yet EBITDA was down £3,303.98. That is not a demand problem — it is entirely a cost-structure problem. COGS is running 8.3 points higher than last August and labour 7.6 points higher.
I'm quoting those as percentage points rather than converting to a cash bridge: the margin metrics aggregate daily rates and don't reconcile cleanly against the P&L lines, so a pounds figure would be spurious.
KPI Tree's Canopy business context layer explains both halves of that.
Why August beat July:
- The King's Head kitchen refit finished ahead of schedule, so the venue reopened a full week early and caught the bank holiday trade that had been written off.
- The Sunday roast menu relaunched across all London venues with sharing boards and a fixed-price family option.
- At Shoreditch, moving quiz night from Tuesday to Thursday lifted revenue per labour hour — Thursdays were dead and the kitchen was already staffed.
Why the year-on-year margin is gone:
- Menu re-costing came back showing produce inflation at about 9%, steeper than budgeted, with beef and dairy the worst offenders.
- The draught supplier raised keg prices 6%, affecting every venue on the same contract.
- Leadership chose to re-engineer the menu rather than raise prices — protecting the headline price going into a soft quarter, but absorbing the inflation into margin. August is what that decision costs.
Two other recorded items shape the read: the area manager is on leave through the bank holiday fortnight (cover split between two senior venue managers, until 22 Sep), and the new till system is blocked on payment provider approval, so the faster table-ordering flow is still switched off at the pilot sites.
All four venues beat July. Against last August, only one is ahead:
- Canary Wharf £24,832.15 — +3.9% (+£934.15) — the only venue up
- Liverpool Street £26,658.84 — -3.9% (-£1,085.55)
- Paddington £26,977.50 — -4.4% (-£1,241.53)
- Shoreditch £32,883.14 — -5.5% (-£1,911.05)
Canary Wharf being the outlier lines up with the recorded decision to hold its staffing flat through the quarter despite the labour cost target, on the grounds that the lunch trade is too volatile to cut cover. On these numbers that call is paying.
Both funded initiatives are aimed squarely at this and both are working month-on-month:
- Menu engineering programme (Rachel Morrison, £45,000 budget, £18,500 spent, 33% progress) targets COGS % down — COGS fell 40.3 → 39.8 July to August.
- Rota optimisation rollout (Michael Patel, £30,000 budget, £12,000 spent, 33% progress) targets labour cost % down — labour fell 23.5 → 22.1. Canopy confirms it went live at the pilot venue with demand-based templates.
So the levers are moving in the right direction; they just haven't clawed back the year-on-year gap yet. Two departmental objectives sit on this — "Reduce labour cost percentage to below 28%" (Oliver Blackwood) is at risk, and "Improve gross margin to 68% across all venues" (Thomas Williams) is nominally on track at 34% outcome progress but only 16.7% execution progress.
One thing August does not explain. The quarterly EBITDA goal of £950,000 (Thomas Williams and Oliver Blackwood, due 30 Sep) stands at £239,950.11 — that is July £99,888.10 + August £111,351.63 + Sep 1–9 £28,710.38, and it reconciles exactly. With 21 days left and August's best-in-quarter month at £111,351.63, that target cannot be reached. Q3-to-date is 44.3% below the same span of Q2 (£430,770.18), so Q2 ran at roughly £143k/month against Q3's ~£105k. That gap is seasonal or structural and predates August; it is not caused by anything in the August numbers.
- Take the keg and produce increases to the P&L, not just the menu. Rachel Morrison owns COGS % and the menu engineering programme. The decision to re-engineer rather than re-price was made before produce inflation came back at 9% — that's a materially different input than when the call was made, and it's Thomas Williams' and Oliver Blackwood's decision to revisit as EBITDA owners.
- The one check that settles it: whether the draught contract is open to renegotiation or a second supplier. Every venue is on the same contract, so it's a single conversation with a group-wide 6% effect. Nobody in Canopy is recorded as owning that — Rachel Morrison is the right person to open it.
- Unblock the till rollout. The payment provider approval is holding the faster table-ordering flow off the pilot sites. That is a phone call to the provider, not an analysis, and it's the one recorded blocker with no owner attached.
- Reset the £950k quarterly target. It is arithmetically unreachable and it is currently making a company objective read as on-track at 29.3%. Thomas Williams and Oliver Blackwood are Responsible.
- Look again on 1 October, when September closes and gives a clean full-month read on whether the two initiatives keep pulling COGS and labour down.
What would change this conclusion: if the August revenue lift was mostly the King's Head reopening early rather than the Sunday roast relaunch, then the underlying like-for-like trade is flatter than +2.8% and the cost story is worse than it looks. I can't separate those — there's no King's Head metric in the tree; the EBITDA search returned only Canary Wharf, Shoreditch, Liverpool Street and Paddington. That's a measurement gap worth closing.
Two things I can do on your say-so: Canopy has a pointer saying the full autumn menu push context — promo dates and first-wave venues — is in the #marketing channel, and I can pull that thread in. I can also record the "revenue up, EBITDA down year on year, cost-driven" finding against EBITDA so it's there next month. Both need your go-ahead — ingesting reads the whole channel and can adopt the Slack workspace as a context source.
Each surface is judged on whether its answer drew on the business context recorded for this question. The judge saw the answers unlabelled, and saying plainly that the data is not there counts in a surface's favour. The judge's own term and specifics count sit under each answer.
Context you can act on. The first answer is the right one. People act on it. Then a workflow runs the whole process.
Every claim in Canopy has been checked against the numbers, so an assistant gets the analysis right first time instead of after a week of follow-ups. That is what gives people the confidence to act on it. And an answer reliable enough to act on every time is one an agent can take the step on, and a workflow can run end to end. Ask it over MCP or in Slack, run KPI Tree's agents on it or build your own, then chain them into your own processes.
Ask it
Make your existing tools right first time. For the numbers that can't be wrong.
From the assistants you already use.

Over MCP
One command adds Canopy to Claude Code, Codex, Cursor or the Claude and ChatGPT desktop apps. The assistant gets the metric tree, ownership, tasks and history, not just a semantic model, and it can file tasks and register hypotheses as well as ask.
~ % claude mcp add --transport http kpitree https://mcp.kpitree.co/mcp
Added HTTP MCP server kpitree with URL: https://mcp.kpitree.co/mcp to local config
~ % claude
> Why is revenue below target?
⏺ kpitree - analyze_metric (MCP)(metric: "Revenue", comparison: "month_over_month")
⎿ Revenue £425k against a £500k target, 15% below. Primary driver: conversion rate, down 23%, Granger-causal at a 3 day lag. Sarah Chen is Accountable.
⏺ Revenue is below target because checkout conversion dropped after Monday's release, not because fewer people arrived. Sarah Chen owns it. Shall I file the rollback as a task?
In Slack
Mention @kpitree in any channel: what is driving the change, who owns it, chart attached, answered from the same causal model.
Emma #revenue
@kpitree what's driving the drop this week?

KPI Tree app · 09:14
Conversion rate, down 23% (Granger-causal, lag 3d). David Mitchell is Responsible.
Run agents on it
Ready-made agents, or build your own.
The agents KPI Tree ships
The action plan, the daily and weekly briefings, the RACI sweep and the Slack assistant. Each is a tile in the gallery: what it does, when it runs, how long it takes, and every run it has ever made with its cost.
Personalised Action Plan
AgentDeclining metrics, their drivers, and the actions that fall to each owner.
Update RACI Assignments
AgentFinds unowned metrics and proposes owners, with reasoning.
Or build your own, for any job
Describe the job in plain English, choose the model it runs on and the tools it may call, then give it a schedule in a workflow. A Monday labour cost check, a supplier price watch, a Friday pipeline sweep: whatever the business needs. Building your own agents is part of the Enterprise plan.
Name
Labour cost watch
Description
Monday check of every site's labour cost against the 28% target
Model
Claude Sonnet 5System prompt
Every Monday, compare labour cost % for each site against the 28% target. For any site over target, name the Responsible manager and file one task with the gap in pounds and the driver behind it. If every site is under target, say so in one line and stop.
get_metric_calculationscompare_dimension_metricsfetch_metric_raci_metricscreate_taskUse this agent in a workflow
Run it on a schedule, in response to a metric or task event, or as one step in a longer flow. Send the result to Slack, email, or another step.
Open in WorkflowsThen automate, end to end
Workflows bespoke to your business processes.
A metric trigger, an agent step, a named approver, an escalation when nobody acts.
Triggers
+6 more
Steps
+2 more
Actions
+2 more
Opus 5.1AgentsWait for Sarah’s approvalAccountable. Escalates in 24hUtilitiesRe-score stalled opportunities
Reforecast deferred revenue
Brief the account owners
Enterprise compliance, from day one. Read-only by design. Governed through your directory.
SOC 2 Type II, continuously monitored
Controls independently examined for Security, Availability and Confidentiality and monitored every day, with CREST penetration testing and the Type II report in the Trust Center.

We do not store your data, calculations run in memory, in real time
KPI Tree reads your warehouse with scoped, read-only credentials and computes every aggregation, comparison and correlation in its own encrypted in-memory engine at the moment it is asked. Nothing is copied into a lake and nothing sits at rest. Anything briefly cached is encrypted with a hardware security module, or with a key you bring yourself.
Warehouse connection
ConnectedRead-only access · credentials never leave the encrypted store
Governed through your directory, for people and agents
SSO with SAML or OpenID Connect, users provisioned and removed from Entra ID, Okta or Google Workspace, audit logs streamed to your SIEM, and IP allowlisting on Enterprise. Agents act only with the permissions of the person who runs them.
- Identity



- Audit logs
 Splunk and any SIEM
- Network
 Approved IP ranges only
The company brain for how your business makes decisions.
Understanding changes behaviour. Dashboards don't. Understand and automate every decision, with a name on every number.
The manifesto
People change when they see the system, see their place in it, and see what moves when they do.
Read why we built KPI Tree
Common questions
What is KPI Tree?
KPI Tree is the company brain for how your business makes decisions. It maps your metrics into causal trees that connect every outcome to the drivers beneath it, proves which relationships hold with statistical tests re-run nightly, gives every metric a named owner with a clear RACI, and tracks every action against the metric it was meant to move until the impact is verified. Canopy, its business context layer, makes all of that available to people and to AI agents, and Canopy Agentic Workflows automate the processes that follow.
What is a company brain?
A company brain is a system that remembers how a business makes decisions: what moved, why, who acted, and whether it worked. Most tools that use the name index documents and chat so an AI can search them. KPI Tree's company brain starts from a statistically proven causal model of your governed metrics and layers recorded context on top, and every claim is checked against the numbers before it counts, so fact and opinion never sit side by side.
What is a business context layer?
A business context layer sits between your data and your AI systems and carries the organisational knowledge raw tables cannot. Canopy is KPI Tree's business context layer. It holds five kinds of context: structural (the metric tree and the org chart), temporal (what was true at any date), behavioural (what people did and whether it worked), operational (RACI, workflows and approvals) and strategic (objectives, key results and initiatives). Every item keeps its provenance.
How is a business context layer different from a semantic layer?
A semantic layer defines how a metric is calculated and returns a governed number. A business context layer adds what a definition cannot: what drives the metric and how strongly, who owns it, what has already been tried and what the plan expects. Canopy does not replace your semantic layer. Keep dbt, Looker or Snowflake Semantic Views as the source of calculation truth, and Canopy syncs those governed definitions and builds the causal, ownership and outcome context above them.
Which AI assistants and agents can use Canopy?
Anything that speaks MCP. One command adds Canopy to Claude Code, Codex or Cursor, and it connects to the Claude and ChatGPT desktop apps, Gemini, Microsoft Copilot, Databricks Genie and Snowflake Cortex. In Slack, mention @kpitree in any channel and the assistant answers from the same causal model. Every answer is scoped to the asking user's permissions.
Does KPI Tree prove causality?
Yes. Every pair of metrics is re-tested for correlation nightly, and every candidate driver runs through proprietary ML models and a cascade of statistical tests, from Pearson correlation and Granger causality to false-discovery control, not LLM pattern matching. The people who know the business prune what the statistics cannot see, and completed actions verify the surviving driver relationships against real outcomes.
How does Canopy learn, and how does it keep fact apart from opinion?
Canopy reads the Slack channels you allow, one channel at a time, and takes facts your people type in against a metric with an expiry. Nothing counts as a fact until it has been checked against the numbers. A claim the warehouse contradicts is held back and says so, and anything later results disagree with is retracted. Every night the model re-reads its own claims against the results that came in, and the ledger shows what held, what was retracted and what is still being watched.
Can we run our own AI agents in KPI Tree?
Yes. KPI Tree ships ready-made agents, including the personalised action plan, the daily and weekly briefings, RACI assignment and the Slack assistant. On the Enterprise plan you can also build your own: describe the job in plain English, choose the model it runs on from Claude, OpenAI or Gemini, choose the tools it may call, and give it a schedule in a workflow. Agents act only with the permissions of the person who runs them, under spend caps, and every run keeps its history and cost.
What can a Canopy Agentic Workflow automate?
Any business process that starts from a signal in the business. Ten triggers are available: a target missed at period close, a metric threshold, a metric outlier, a metric gone stale, a task event, a RACI assignment, a company briefing being ready, a schedule, an inbound webhook, or a manual run. Steps run agents, query metrics, branch, delay and wait for a named approver, and actions post to Slack, send email, create tasks, assign RACI, escalate up your org chart when nobody acts, and call any external system.
How is KPI Tree different from a BI tool like Tableau or Looker?
Tools like Tableau and Looker are built to visualise data on dashboards and charts, leaving you to interpret what a number means. KPI Tree is built to drive decisions. It connects each metric to its causal drivers, its named owner and the actions meant to move it, then verifies whether those actions worked. A dashboard tells you a number went down. KPI Tree tells you why it moved, who owns it, and what to do next.
Is KPI Tree SOC 2 compliant, and where does our data live?
Yes. The KPI Tree platform is SOC 2 Type II, independently examined for Security, Availability and Confidentiality and monitored continuously, with CREST penetration testing and the Type II report available in the Trust Center on Growth plans and above. Your data stays in your warehouse: KPI Tree connects with scoped, read-only credentials and runs one scheduled query per metric. Anything cached is encrypted at rest with a hardware security module, or with a key you bring yourself.